A live 3D interface that mirrors a physical asset in real time — syncing sensor data, surfacing anomalies, and giving operators a single source of truth they can actually read.
Build Something Like This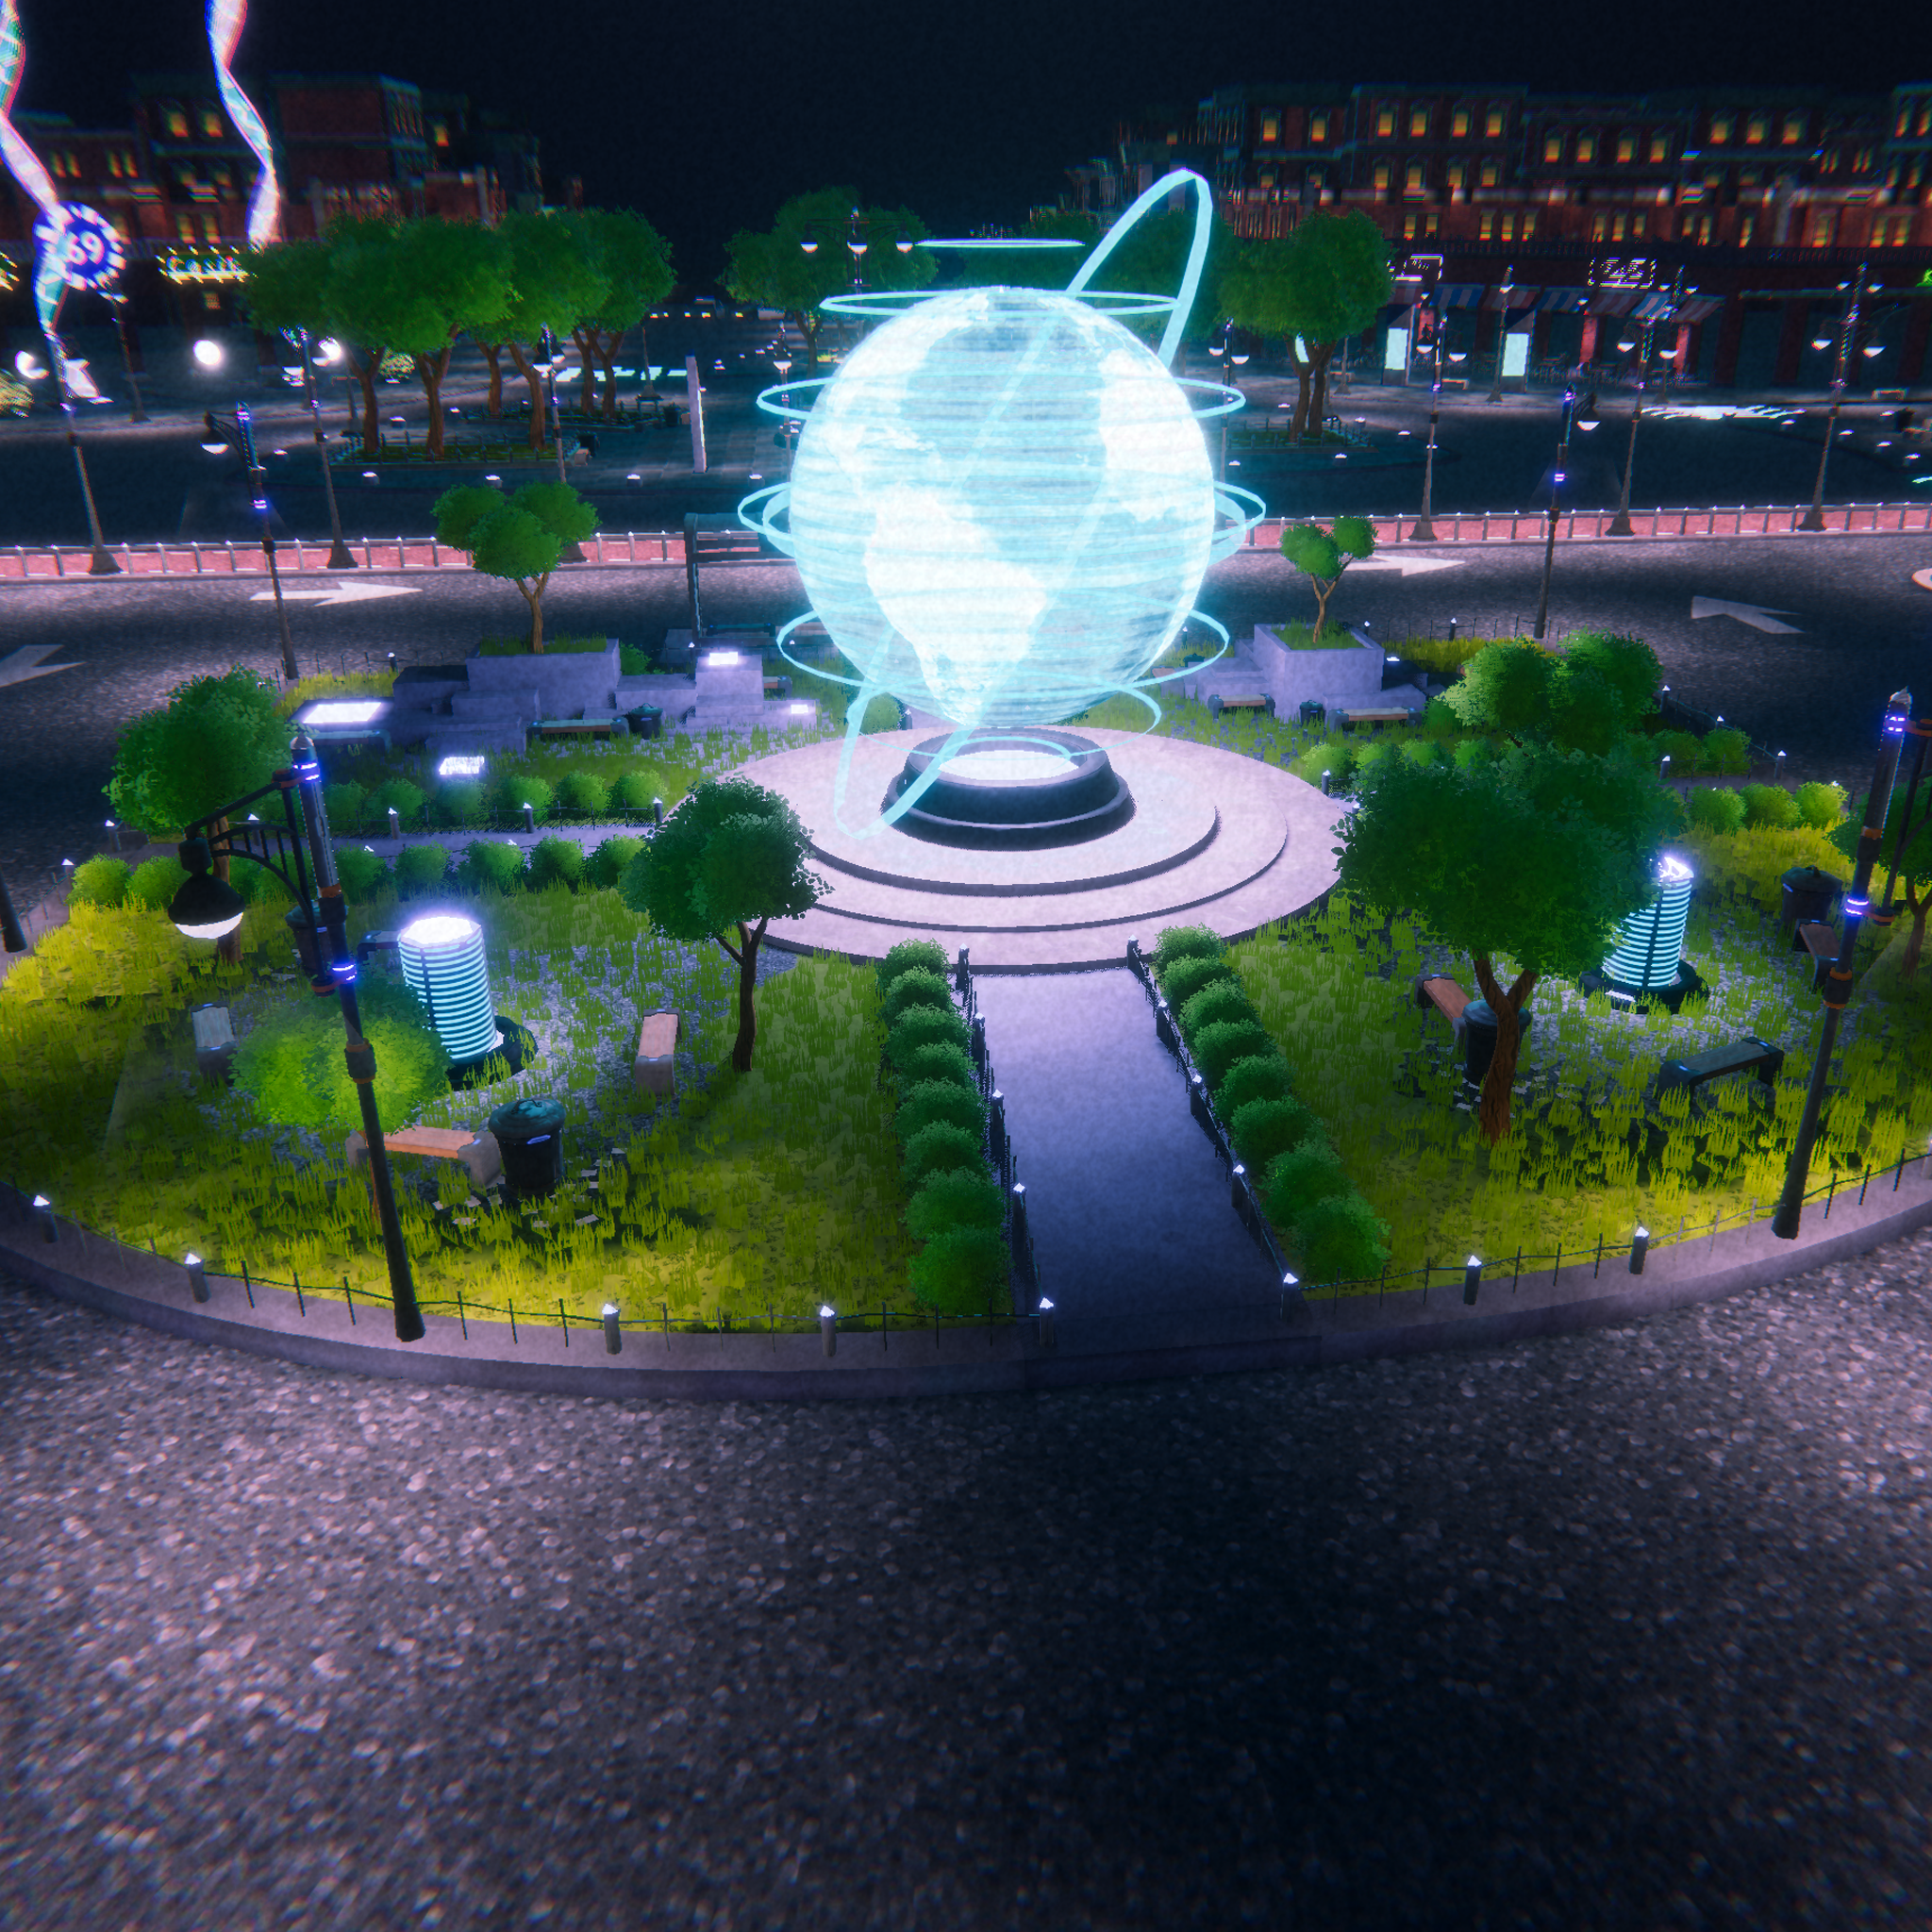
Spreadsheets and static dashboards lose the plot when you're managing a complex physical asset. This digital twin syncs a 3D model of the real environment to live sensor data — so operators see exactly what's happening, where, and when.
Anomalies surface as visual highlights directly on the 3D model. Historical data, alert thresholds, and maintenance logs are a click away from any component — no hunting through separate systems.
WebGL 3D rendering, WebSocket live data feed, REST API integration with existing sensor infrastructure.
To be confirmed — this project is currently in active development.
Built for industrial and infrastructure clients — specific sector to be announced.
Replace fragmented monitoring tools with a single browser-based interface that anyone on the team can read at a glance.
Tell us about your project and we'll get back to you within 24 hours.
Get in Touch